The basic elements of statistics explained
In this section of technology, we will explain the basic elements of statistics and how they affect the terminology surrounding an analytical method and validation of such.
Statistics is basically mathematics applied to various scenarios to aid a precise interpretation of numbers that are not easy to interpret. Statistics deals with the probabilities and uncertainties and is a useful way to become certain of the uncertainties and the sources of these. If the statistics are well understood an analytical method and its associated performance can be well described and confusion and conflicts can be avoided.
Elementary probability
The easiest way of understanding probability is to roll a dice and ask what is the chance (probability) that you will get a “1” and the answer to that is 1 out of 6 or = 16.7%. The analytical equivalent is to ask how certain we are when the analyser shows 15.73% – a lot of decimals lead to a misunderstanding that it is more certain, but in reality, it may just be more precisely wrong.
The normal distribution
Some of the most relevant statistical tools are the normal distribution and the word “standard deviation”.
The normal distribution is the word associated with the “bell shaped” probability curve shown below. This curve describes the link between probability and incident.
µ = The micro sign denominates the average value of all incidents
σ = The Greek letter sigma denominates a standard deviation.
It is defined that numbers/incidents in a population are distributed as follows:
µ +/- 1 sigma = 68.2% of population
µ +/- 2 sigma = 95.4% of population
µ +/- 3 sigma = 99.7% of population

Example:
You have bought a box of 100 apples, size 65 mm. The small print says (1 sigma 2 mm) after 65mm. Clearly all the apples are not identical in size, what can you expect from this box? The average size (µ) will be 65 mm!
(34.1 % + 34.1 % =) 68.2 % * 100 apples = 68-69 apples will be 65 mm +/- 1 sigma (σ) ( +/- 2 mm) Some 63 mm others 67 mm.
(13.6 % +13.6 % =) 27.2 % * 100 apples = 27-28 apples will be more than 2 mm but less than 4 mm away from 65 mm average.
(2.1 % + 2.1 % =) 4.2 % * 100 apples = 4-5 apples will be more than 4 mm from average.
Even worse: 2 of 1000 apples MUST be way off for the other numbers to be true.
This kind of statistics applies to analytical numbers as well.
Analytical terms
Statistics plays a very significant role in describing the performance of an analytical method.
It may be useful for a full description of the performance to include at least some of the following in statistical terms:
- The expected agreement with the chosen reference method.
- The expected repeatability
- The reproducibility
- The sample handling/filling variance
- The sample-to-sample variance
- The day-to-day variance
- Effect of environmental variance
Different words can be used to describe the same. Words that describe how close you are on average to the right values include:
- Accuracy
- Agreement
Words that describe the results obtained with the same method on identical test items in the same laboratory by the same operator using the same equipment within short intervals of time:
- Repeatability
- Short term stability
- Precision
Words that describe results produced by using the same method, but where all other circumstances can vary:
- Reproducibility
- Long term stability
To describe a method, one must include one term from all three groups. We will be using the terms agreement, repeatability, and reproducibility
Agreement
A NIR method is a secondary method, 100 % dependent on the primary method used for calibration. The term agreement describes how well the NIR method agrees with the reference method. Graphically it’s often shown like this.

The red dot marks a sample that does not ”agree” 100%, but which is right and wrong?
Both methods have a contribution to the error. Quantify them both before judging one method.
In the example, the agreement is expressed in statistical terms as 1 sigma = 0.38 should be interpreted as the result of the NIR method agreeing with the primary method in 68,2 % of all cases within +/- 0.38 (1 sigma) and in 99.7% of cases is within +/- 1.14 (3 sigma) and as the sample is within these limits, the agreement is ok.
Repeatability
Repeatability is a very important parameter when one describes a method, since it is the ability to repeat the same result multiple times in a row within a certain defined (hopefully small) range. For an in-line analyser it may translate to the smallest change in production detectable with the analyser.
Look at the below target shooting.
Case A: High repeatability, low agreement
Case B: Low repeatability, high agreement (on average)
The two problems need very different remedies to fix and only a well-documented scenario can be fixed.

Reproducibility
Reproducibility is related to repeatability, but rather than leaving the sample in place and run it 10 times to test the hardware short term stability, we move to test the surrounding robustness of the method in order to answer questions like:
- Will I get the same answer tomorrow?
- Will another person get the same result?
- Will I get the same in another sample container (glass jar, petri dish, vial)
- What if I pack 5 samples from the same main sample?
Only way to know is to test!
It should be noted that the agreement is affected by poor repeatability and reproducibility and a good rule of thumb is that the stability parameters should not exceed 33% of the agreement i.e. From the example with a Std Dev of 0.38 the ”scatter” from repeated measurements should be less than (0.38*/3 = 0.13). A standard deviation of stability of 0.13 follows the same rules as any other standard deviation, 1 sigma = 0.13!
Practical example
A NIR analyser runs analysis of chicken feed. In this example we focus on the component Fat. Running 10 different samples with the analyser and the reference lab yields the below table of results.
| NIR fat (%) | Lab fat (%) | Difference (%) |
| 12.65 | 12.92 | 0.27 |
| 13.11 | 12.79 | -0.32 |
| 8.93 | 8.67 | -0.26 |
| 13.17 | 13.36 | 0.19 |
| 12.22 | 12.17 | -0.05 |
| 11.88 | 12.12 | 0.24 |
| 12.79 | 13.19 | 0.4 |
| 11.03 | 11.41 | 0.38 |
| Average deviation (µ) | 0.106 (%) | |
| Standard deviation | 0.263 (%) |
At first glance this does not look too good, so we need to dig further in to understand the statistics and sources of error.
The average value of 0.106 could be interpreted as a systematical error, in this case that the lab in average is 0.106 % higher than the NIR analyser. This is however far from certain as the average is calculated over 8 results only and the “bias” is less than 50% of the agreement hence it is not likely that it is what the statistics call “significant”. To determine a bias/systematic error one needs more data over time and perform a real calculation of significance (not covered in this intro).
First step is to investigate the repeatability contribution. We simply leave one sample on the analyser and run it 8 times.
| Repeat | Fat (%) |
| 1 | 12.58 |
| 2 | 12.71 |
| 3 | 12.72 |
| 4 | 12.60 |
| 5 | 12.77 |
| 6 | 12.74 |
| 7 | 12.69 |
| 8 | 12.79 |
| Repeatability (σ) | 0.07 (%) |
Sampling error
This error covers multiple glitches in the analytical process from primary sampling to the mere fact that the NIR analyser and reference method de-facto do not see the same sample.
In this small example we focus on the part of sampling error related to reproducibility in handling and heterogeneity which can be observed by filling the analyser cup say 8 times from the same primary sample and run the analysis. If the sample is perfectly homogeneous the results will all be the same, but that is very seldom the case, and this will relay back to the fact that the NIR analysers sees one sample and the reference method another.
| Sample replicate | Fat (%) |
| 1 | 12.81 |
| 2 | 12.63 |
| 3 | 12.69 |
| 4 | 12.63 |
| 5 | 12.77 |
| 6 | 12.87 |
| 7 | 12.79 |
| 8 | 12.54 |
| Reproducibility (σ) | 0.10 (%) |
Error budget
We can now build an error budget and assess the findings based on this. In this way it becomes a calculation and not a feeling whether a given analyser is in statistical control.
The three major contributions to the NIR agreement is shown below
- a = Reference method
- b = Reproducibility
- c = Repeatability
The math approximates the contributions as follows
Agreement STD dev ≈ (a 2 +b 2 +c 2 )½
We know that a = 0.23
We know that c = 0.07
We know that b = 0.1
The known error sources are distributed like this and it is obvious that the reference method play a significant role.

a 2 +b 2 +c 2 = (0.23)2 + (0.07) 2 + (0.1) 2 ≈ 0.26 %
Conclusion
The observed agreement between the reference method and the NIR analyser matches the calculated error budget and we say that the analyser is in statistical control as the error can be explained.
If we wish to improve the method, we should target the reference method as this will have the largest effect on the result.
Control chart
A control chart is a graphical visualization tool to follow the development of statistical errors over time. If a method is part of a critical control process or a vital part of keeping income at the right level, it is essential to keep tracking the agreement to run the processes as close to target as possible.
Loss of agreement means loss of profit.
Below is a typical example of a control chart for the agreement of fat determination in raw milk. Even small deviations are likely to cost money or product quality.
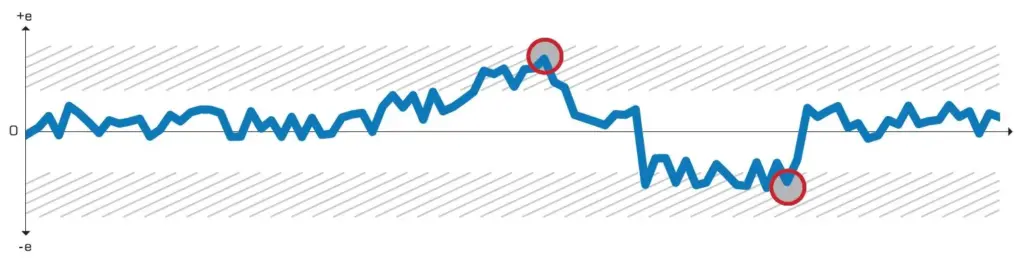
A control chart is characterised by data plotted over time. The control chart has a center line and one or several sets of upper and lower control limits. As long as the data jitters between the upper and lower limits, no adjustments are done as the process or result are deemed “in control”. If one were to adjust based on a single result severe biases and process running of target is the result.
We create value for you
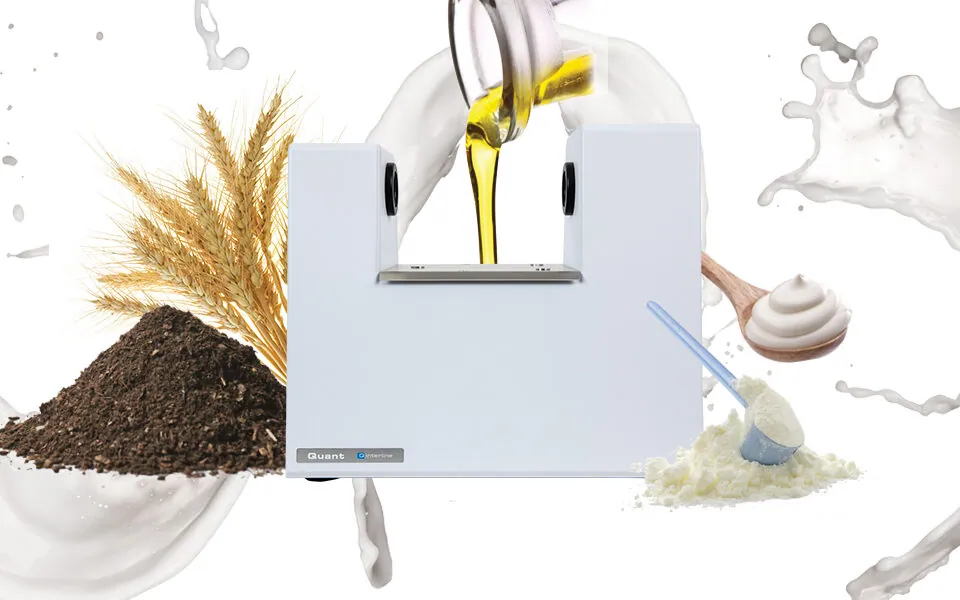
Our vision is to be the best provider of FT-NIR analytical solutions in the world. We help our customers:
- Ensure product quality
- Optimise raw material utilisation
- Optimise production processes
- Reduce energy consumption
in an easy, precise, and efficient way with our patented FT-NIR solutions.
We work with customers within dairy, agriculture, food and ingredients and in the Nordics also within pharma and chemical.