The technology of NIR Spectroscopy explained
The history of infrared spectroscopy
The history of infrared spectroscopy dates back to Sir William Herschel’s discovery of what he called “radiant heat” around the year 1800. At that time, there was no concept of what we know today as the electromagnetic spectrum. Therefore, Herschel erroneously concluded that his discovery was different from visible light in nature.
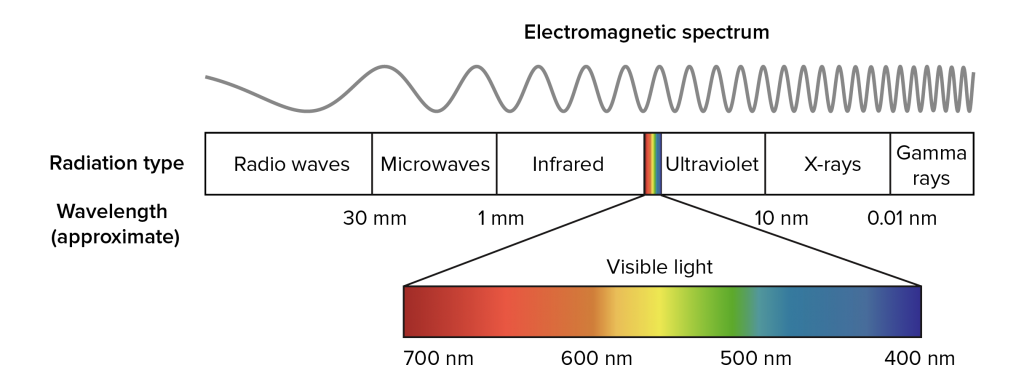
This error was corrected by Ampere in 1835 when he showed that visible and infrared light had the same optical properties, thereby introducing the idea of an extended spectrum. Later, the works of James Clerk Maxwell and Max Planck laid the foundations to the full understanding of the electromagnetic spectrum shown below. The infrared (IR) region is a subset of the electromagnetic spectrum neighbouring the visible region, spanning the wavelength range from 0.8 − 1000μm.
The infrared region
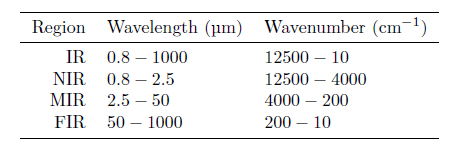
While the interaction between infrared radiation and molecules occurs in the entire infrared region, the properties differ depending on which range of wavelengths one considers. For this reason, the infrared (IR) region is further divided into the three subregions: near infrared (NIR), mid infrared (MIR) and far infrared (FIR) as shown in the table.
One property distinguishing NIR from MIR is that MIR is dominated by narrow fundamental absorption bands, while NIR primarily contains broad absorption bands stemming from overtones.
A practical issue related to using spectroscopy is the radiations’ ability to pass through the sample of interest. For NIR applications, the radiation can typically pass through several cm of material, while for MIR and FIR, the sample thickness must typically be on the order of μm, severely complicating the sample preparation.
The physics of NIR spectroscopy
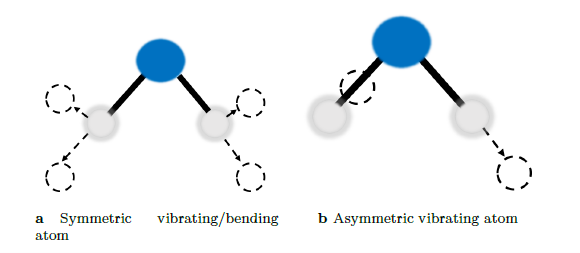
To understand the fundamentals of infrared spectroscopy, one must turn to a quantum mechanical interpretation of molecules. First, consider the water molecule as illustrated in figure 3. The water molecule can exhibit symmetric and asymmetric vibrations and/or bending in its molecular dipole moment. Interaction between infrared radiation and the molecule can only occur if the frequency of the infrared radiation and that of the molecular dipole moment match.
An approximation of a molecule consisting of two atoms is a system consisting of two masses, m1 and m2, connected by a spring. This model is known as the harmonic diatomic oscillator model. In this model, the fundamental frequency, v0, can be calculated using Eq. 1, where k is the force constant of the bond/spring and m is the reduced mass of the atoms.

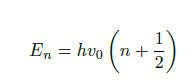
Furthermore, the energy required for a transition to a higher excitation level of the molecule can be calculated by Eq. 2, where h is Planck’s constant and n is the integer vibrational quantum number. The result of the harmonic oscillator model is that energy levels are equidistant and only transitions to adjacent energy levels are allowed.
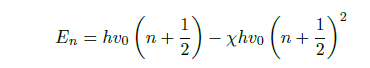
However, as the harmonic oscillator model is not applicable at larger excitation levels, as the bond will simply break, for example, the anharmonic oscillator model is used instead. This model states that the higher excitation levels are given by Eq. 3, where X is the anharmonicity constant. Contrary to the harmonic oscillator model, the anharmonic oscillator model allows transitions to higher excitation levels than the neighbouring levels. These levels correspond to the first and second, etc. overtones over the fundamental vibration.
A linear polyatomic molecule consisting of N atom has 3N −5 degrees of freedom, while a non-linear polyatomic molecule has 3N − 6 degrees of freedom. In the mid infrared region, the primary transitions are the so-called fundamental transitions corresponding to transitions between n = 0 to n = 1.
However, as the near infrared region is dominated by overtones (Δn > 1) which absorbs light of higher energy, and with much lower absorption coefficient. The overtone absorption bands are typically broad and overlapping as illustrated in figure 4 and originating from X-H stretching vibration where X is a heavier atom typically C (Carbon), N (Nytrogen), or O (Oxygen).

FT-NIR spectroscopy
By far the most interesting aspect of our technology is the stability over time combined with unmatched optical specifications (see below). As the only commercial spectrometer on the market, it has a published specification for the unit to unit similarity, making it the ideal choice for customers with more than one unit as they enjoy the upside of only calibrating the mother unit and copying calibrations directly to the slaves, with no transformations or tweaks.
The 24-bit signal processing has given the unit the ability to work with a dynamic range not seen earlier. Peaks of 4 abs and noise levels of under 1 micro-abs are the de-facto new standard.
Specifications comparison
It is not trivial to compare the published performance of the Quant engine, used in all Q-Interline solutions, to other commercial spectrometers. No industry standard exists for such specifications and everybody will tend to market their strongest sides. We believe that high standards matter and that a stronger spectrometer will support your business case in the best possible way.
The performance of a spectrometer can be divided into short- and long-term specifications, but collectively only a few parameters are of importance.
- Will the spectrometer find a given peak in the spectrum at the same position over time and from unit to unit? If not the PLS calibration model will react strongly.
- The relevant specification is x-axis accuracy and repeatability (also unit to unit)
- Will the spectrometer over time report the peak at the same height?
- The relevant specification can be resolution stability and noise parameters.
- Will the spectrometer report the peak as the same shape over time and from unit to unit? If not, the PLS model will react strongly as the PLS loadings will no longer fit.
- The relevant specifications are resolution, bandwidth stability, etc.
| Parameters | Quant published specs | Meaning |
|---|---|---|
| X-Axis accuracy | < 0.01 cm-1 or < 0.0018 nm | Any given peak will be accurate to the very last decimals and typically 200 times better than leading dispersive brands. |
| X-axis precision | < 0.006 cm-1 or < 0.0011 | This means the peak is found over and over again in the same position and this means stability to the end user. Typically 10 times better than leading dispersive brands. |
| Noise | >500.000:1 (InAs) or < 1 uAbs | Our extreme low noise which is 20-100 times better than most competitors means a unique ability to see very small differences or changes in products and processes. |
| Resolution | Variable 2 -64 cm-1 = 0.2 – 6 nm | Resolution in itself is not majorly important due to the nature of the products with broad peaks, but the shape stability of the instrument means easiest transfer of models possible. |
Fibre optic spectroscopy
Fibre optics play a significant role in the development of modern in-line FT-NIR system and hence in Q-Interline’s solution, InSight Pro.
The use of fibres enables remote sampling, i.e., the spectrometer can be placed out of harm’s way and light is sent through fibres to measurement probes and cells. The InSight Pro uses fibre bundles as long as 30 meters. The use of fibre optics further supports the use of optical multiplexing, allowing multiple fibres to send and receive light from the same spectrometer. This reduces the price per measurement point.
Learn more about the theory behind the optical fibres in the video link.
We create value for you
Our vision is to be the best provider of FT-NIR analytical solutions in the world. We help our customers:
- Ensuring product quality
- Optimizing raw material utilization
- Optimizing production processes
- Lowering energy consumption
in an easy, precise, and efficient way with our patented FT-NIR solutions. We work with customers within dairy, agriculture, food and ingredients and in the Nordics also within pharma and chemical.